Pump curves are essential tools for selecting and operating centrifugal pumps, but interpreting them can be challenging for even seasoned professionals. Misreading a pump curve can lead to costly mistakes such as undersized pumps, inefficient operation, and premature failure.
In this guide, we will demystify pump curves and provide a step-by-step approach to reading them correctly. By mastering the anatomy of a pump curve and learning how to locate the optimal operating point, you will be equipped to make informed decisions when specifying and troubleshooting pumps in your facility.
What is a Pump Curve
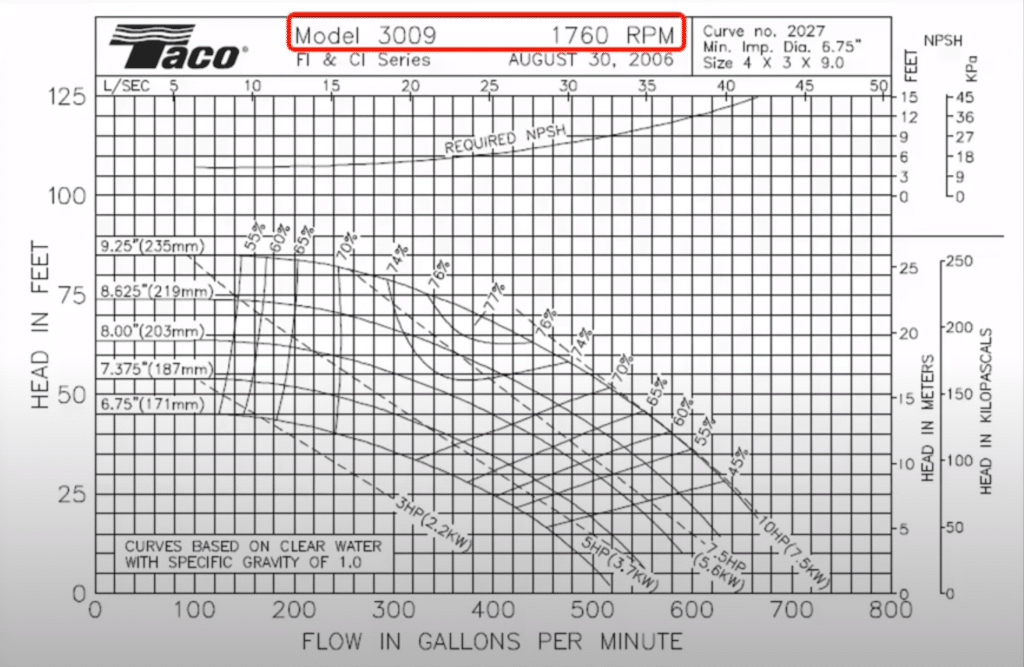
A pump curve is a graphical representation of a centrifugal pump‘s performance characteristics. It illustrates the relationship between the pump’s flow rate, pressure (head), efficiency, and power requirements under different operating conditions. Pump curves are essential tools for selecting the appropriate pump for a specific application and optimizing its performance.
Pump manufacturers generate these curves through extensive testing, measuring the pump’s performance at various flow rates while maintaining a constant impeller diameter and speed. The resulting data points are plotted on a graph, creating a curve that represents the pump’s performance characteristics.
Anatomy of a Centrifugal Pump Curve
X-axis
The x-axis of a pump curve represents the pump’s flow rate, generally measured in gallons per minute (GPM) or cubic meters per hour (m³/h). As you move from left to right along the x-axis, the flow rate increases.
Y-axis
The y-axis depicts the head, which is the pressure that the pump can generate at a given flow rate. Head is typically expressed in feet (ft) or meters (m) of the liquid being pumped. The head decreases as the flow rate increases, forming the pump’s head-flow curve.
Head-Flow Curve (H-Q Curve)
The head-flow curve, also known as the H-Q curve, illustrates the relationship between the pump’s head and flow rate. It shows how the head varies with the flow rate, with the head decreasing as the flow rate increases.
Efficiency Curve (E-Q Curve)
The efficiency curve, or E-Q curve, represents the pump’s efficiency at different flow rates. Efficiency is expressed as a percentage and indicates how effectively the pump converts input power into useful work. The efficiency curve typically peaks at a specific flow rate, known as the best efficiency point (BEP).
Power Curve (BHP Curve)
The power curve, often referred to as the brake horsepower (BHP) curve, shows the power required by the pump at various flow rates. Power is usually measured in horsepower (HP) or kilowatts (kW). The power curve generally increases with the flow rate, as more power is needed to maintain higher flow rates.
Best Efficiency Point (BEP)
The best efficiency point is the flow rate at which the pump operates with the highest efficiency. Operating the pump near its BEP ensures optimal performance, reduced energy consumption, and extended pump life. The BEP is located at the peak of the efficiency curve.
Net Positive Suction Head Required (NPSHr) Curve
The net positive suction head required (NPSHr) curve indicates the minimum pressure required at the pump inlet to prevent cavitation. Cavitation occurs when the liquid being pumped vaporizes due to low pressure, causing damage to the pump’s components.
PSI Formula
In the Imperial unit system, pressure is measured in pounds per square inch (PSI), while head is measured in feet. The formula to convert between PSI and feet of head is:
Head (feet) = PSI x 2.31 / Specific Gravity
where:
- Head is the equivalent height of a column of liquid that the pump can lift against gravity
- PSI is the pressure generated by the pump in pounds per square inch
- 2.31 is a conversion factor based on the density of water at 4°C (39.2°F)
- Specific Gravity is the ratio of the density of the liquid compared to water. For water at 4°C, the Specific Gravity equals 1.
For example, if a pump generates a pressure of 50 PSI while pumping water, the equivalent head would be:
Head = 50 PSI x 2.31 / 1 = 115.5 feet
This means that the pump can lift a column of water up to 115.5 feet high. The head value is what is typically plotted on the y-axis of a pump curve.
If the pressure is expressed in kPa (kilopascals) instead of PSI, a different conversion factor must be used to get head in meters rather than feet.
Reading a Pump Curve: A Step-by-Step Guide
Step 1: Identify Your Requirements
Before examining the pump curve, clearly define your system requirements. Key factors include:
- Required flow rate (Q) in gallons per minute (gpm) or cubic meters per hour (m³/h)
- Total dynamic head (H) in feet or meters, accounting for static head, friction losses, and pressure requirements
- Fluid properties such as viscosity, specific gravity, and temperature
- Net positive suction head available (NPSHa) based on your system design
Step 2: Locate the Operating Point
On the pump curve, find the point where your required flow rate (Q) intersects with the total dynamic head (H). This intersection is known as the operating point or duty point. It indicates the head and flow rate the pump will produce in your system.
Step 3: Determine Efficiency
Trace a vertical line from the operating point to intersect the efficiency curves (E-Q). This will indicate the pump’s efficiency at your required flow rate. A higher efficiency means less power consumption and lower operating costs. Aim to select a pump that operates close to its best efficiency point (BEP).
Step 4: Calculate Power Requirements
From the operating point, trace a horizontal line to the left to intersect the power curve (BHP). This will indicate the brake horsepower required to drive the pump at the specified flow rate and head. Ensure the selected motor has sufficient power to handle this requirement.
Step 5: Check NPSHr
Locate the NPSHr curve that corresponds to your impeller diameter and flow rate. The NPSHr represents the minimum pressure required at the pump inlet to prevent cavitation. Ensure your system’s NPSHa exceeds the pump’s NPSHr by an appropriate margin, typically a minimum of 1-2 feet or 0.3-0.6 meters.
Step 6: Understand the Operating Range
Pumps operate most efficiently and reliably within a specific range around the best efficiency point (BEP). Operating too far to the left or right of the BEP can lead to reduced efficiency, increased wear, and potential damage. As a general rule, aim to operate the pump between 70% and 120% of its BEP flow rate.
What is the relationship between pump curve power vs flow rate
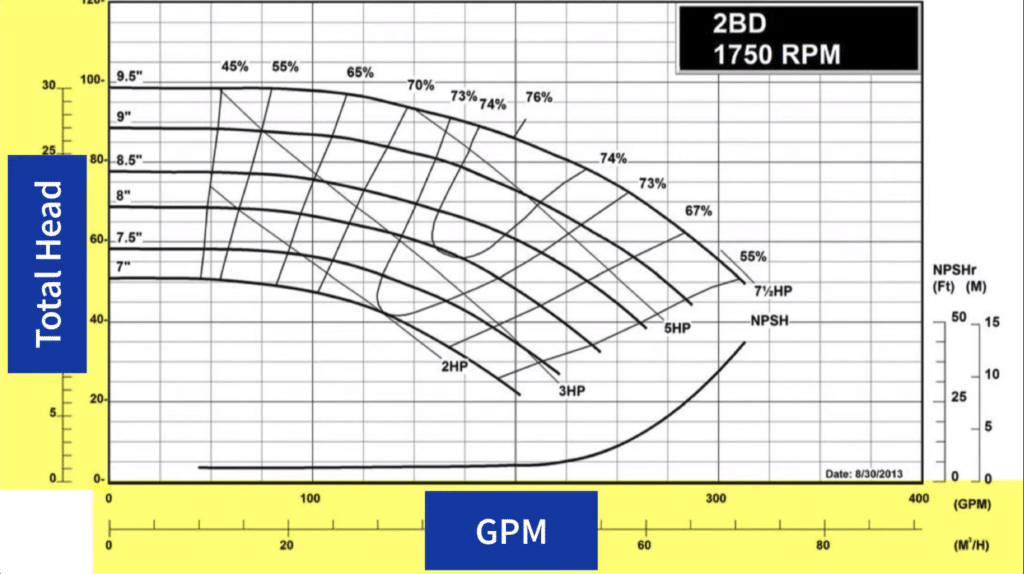
The relationship between power and flow rate on a pump curve is not linear. As flow rate increases, the power required typically increases as well, but at a faster rate. This is because power is proportional to the cube of the flow rate (P ∝ Q³).
On the pump curve, the power (BHP) curve will start low at zero flow and rise exponentially as flow rate increases.
It’s important to note that the pump’s efficiency also varies with flow rate. The best efficiency point (BEP) occurs at a specific flow rate where the pump operates most efficiently. Operating too far below or above the BEP flow rate will result in reduced efficiency and higher power consumption per unit of flow.
