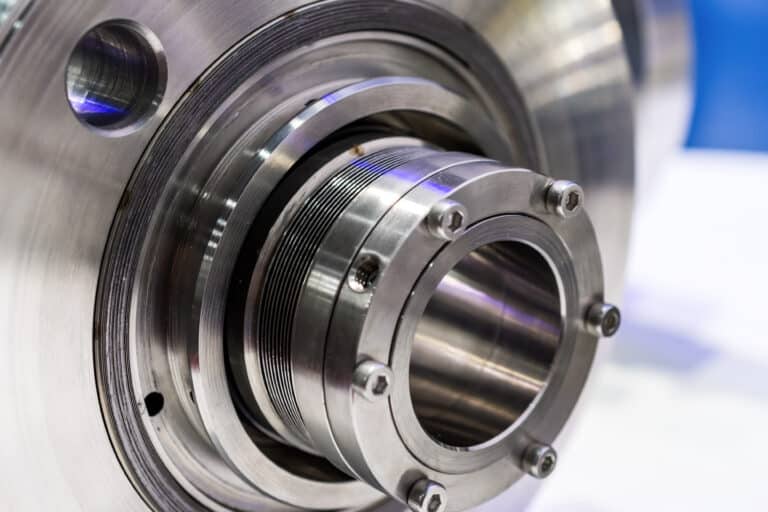
A mechanical seal with a 0.2 mm face defect passes the standard API 682 air test — then leaks 1,300 times the allowable rate under 40 bar operating pressure. That gap between test bench and field performance is why differential pressure (DP) decay testing, properly configured for seal geometries, catches defects that standard integrity tests miss. Small internal volumes, face flatness requirements, and thermal sensitivity create testing dynamics that generic leak test procedures never address.
Why Standard Seal Integrity Tests Miss Real Defects
The API 682 integrity air test uses 1.7 barg charge pressure, a maximum 28-liter test volume, five-minute duration, and 0.14 bar maximum allowable pressure drop. What the spec sheet doesn’t tell you is that the test was designed only to detect assembly defects, not to verify seal quality.
The face separation that produces the maximum allowable leakage (56.9 g/hr air) equates to a 4-6 micron gap. Operational face separation on a running seal is 0.5-1 micron. The test cannot distinguish between a well-lapped seal and one with face damage four to six times beyond operational tolerance.
I’ve seen this failure pattern dozens of times. AESSEAL tested a seal with a deliberate 0.008-inch orifice defect at the standard 26.5-liter volume. Pressure dropped exactly 2 psi — a marginal pass. Under pressurized fluid, the same seal leaked 1,500 g/h at 2 barg (270 times allowable), 3,000 g/h at 7 barg, and 7,500 g/h at 40 barg. The standard test method gave a pass certificate to a seal that would fail catastrophically in service.
DP decay testing eliminates this gap — but only when test parameters account for seal-specific volume and sensitivity requirements.
How Differential Pressure Decay Works for Seal Testing
Test Sequence and Parameters
DP decay compares pressure between a sealed test volume containing the seal and a matched reference volume. Both charge simultaneously, then isolate. Any leak from the test side creates a growing differential, while environmental disturbances affect both sides equally and cancel out.
A typical seal test cycle runs three phases:
- Charge phase: Pressurize both volumes to 1.5-2 times the seal’s rated working pressure. Duration: 2-5 seconds for small seal cavities.
- Stabilization phase: Hold pressure with no measurement. Adiabatic heating from compression must dissipate before measurement begins. For volumes under 50 cc, 5-15 seconds is typical — but measure your specific thermal time constant rather than guessing.
- Measurement phase: Record the differential pressure change over 10-30 seconds. Longer measurement improves signal-to-noise but extends cycle time.
Leak Rate Calculation
Raw pressure drop alone is meaningless without volume context. The correct specification uses leak rate:
Leak Rate = (Pressure Drop x Test Volume) / Atmospheric Pressure
A 0.017 psi/sec pressure drop in a 7.5 cc seal fixture yields 0.52 cc/min leak rate. That same drop rate in a 26.5-liter fixture indicates a leak 3,500 times larger. Volume masks the leak — larger volumes absorb more pressure change before the transducer detects anything.
Every DP decay acceptance criterion for seals must state leak rate, not pressure drop. Specifying a maximum pressure drop without specifying volume is engineering malpractice.
When a DP decay test rejects a seal, the leakage paths fall into predictable categories: damaged O-rings, scratched seal faces, or improper seating — all assembly defects that should never reach the field.
Test Volume and Acceptance Criteria
Why Volume Controls Sensitivity
Mechanical seal internal volumes range from 10 cc for small single seals to perhaps 500 cc for large dual arrangements. Standard leak test fixtures designed for automotive or aerospace parts carry 5-30 liters of dead volume in plumbing, fittings, and manifold. That mismatch destroys sensitivity.
AESSEAL proved the impact definitively. The same 0.008-inch defect that produced a marginal 2 psi drop in a 26.5-liter volume produced 22 psi in a 1.5-liter volume — an 11 times clear failure. Non-defective seals showed zero drop at the reduced volume.
For seal testing, I design fixtures to minimize dead volume aggressively. The test cavity should closely conform to the seal geometry, with short, small-bore connections to the transducer. Every unnecessary cubic centimeter costs sensitivity.
Instrument resolution must be at least 100 times finer than the reject specification. For seal volumes under 50 cc, that means transducers resolving to 0.007 Pa or better.
Setting Reject Thresholds
Build thresholds from good-part data, not specification sheets. Run 30 or more known-good seals through the test, record the leak rate distribution, and set the reject limit at 3 sigma above the mean. This accounts for your specific fixture volume, thermal environment, and instrument characteristics.
The fixture must clamp the seal with 1.5 to 2 times the force that test pressure exerts on the seal’s internal area. Insufficient clamping allows the seal to shift under pressure — creating a false leak path that has nothing to do with seal quality.
Thermal Drift and False Reading Sources
Thermal Drift Compensation
A one-degree temperature shift in a 25 cc seal cavity produces a pressure change that can exceed the actual leak signal by 10 times. That makes thermal drift the single largest source of false readings in seal DP decay testing — and small internal volumes amplify it.
DP decay’s advantage is that both volumes experience the same thermal event. But this cancellation works only when the reference volume closely matches the test volume in size and thermal mass. For seal testing, match volumes within 10%, fabricate from the same material, and mount in the same thermal environment.
When volumes cannot be perfectly matched, thermal drift follows a predictable pattern: an exponential decay curve superimposed on the linear leak signal. Waiting for 4 times the thermal time constant before measurement reduces thermal error to less than 0.25 cc/min. Measure your fixture’s time constant during commissioning — do not use published generic values.
Elastomer Absorption and Other Artifacts
Elastomeric components — O-rings, bellows boots, PTFE wedges — absorb pressurized gas. The pressure trace looks identical to a slow leak: a gradual, steady decline that stabilizes over time.
The difference is timing. A real leak produces a linear pressure drop that continues indefinitely. Elastomer absorption follows a logarithmic curve that flattens as the material saturates. Extend the measurement phase by 50-100% and compare decay rates in the first and second halves. Decreasing rate means absorption. Constant rate means leak.
Two other false reading sources specific to seal testing:
- Fixture seal creep: Test fixture O-rings under sustained pressure can creep, mimicking a leak. Replace fixture seals on a fixed schedule, not when they fail.
- Face film effects: A thin oil film on seal faces drastically reduces air leakage. Dry-tested seals show higher apparent leak rates than the same seal with a face film. Standardize face preparation to eliminate this variable.
When to Use DP Decay vs Helium vs Hydrostatic
DP decay sensitivity sits around 1 x 10^-3 sccm. Helium mass spectrometry reaches 1 x 10^-6 to 1 x 10^-9 sccm — three to six orders of magnitude more sensitive. Hydrostatic testing with visual inspection catches only gross leaks.
For mechanical seal bench testing, DP decay with optimized volume provides the right balance. The defects that cause field failures — damaged O-rings, face scratches, improper seating — produce leaks well within DP decay’s detection range. Cycle times of 10-60 seconds support production-rate testing.
Reserve helium for dual seals in hazardous or critical service where regulatory mandates apply. For standard single seal qualification, helium over-specifies sensitivity and increases false reject rates from surface porosity and minor elastomer permeation that have zero impact on liquid sealing performance.
One limitation applies to all air-based testing: a seal that leaks air may seal liquid acceptably, and vice versa. Liquid viscosity and surface tension provide sealing forces that air does not. DP decay air testing verifies assembly integrity and face condition — it does not predict liquid sealing performance at operating conditions.
Building a Reliable Seal Test Program
The difference between a DP decay test that catches defects and one that generates noise comes down to three factors: volume, thermal control, and statistical thresholds. Minimize fixture dead volume to match your seal geometry. Match reference and test volumes to within 10% and let thermal equilibrium establish before measuring. Set reject limits from measured good-part distributions, not specification maximums.
The API 682 air test serves its intended purpose as an assembly defect screen. For seal manufacturers and end users who need to verify face condition, O-ring integrity, and overall seal quality before installation, DP decay with optimized parameters provides detection capability that standard methods cannot approach. Start with your smallest-volume seal, build a 30-part baseline, and validate the measurement system before trusting it for production screening.